
A production-pattern operational telemetry dashboard built with Python, PyMongo, and Plotly Dash. Provides real-time dynamic record filtering, automated demographic breakdowns, and zero recurring SaaS license overhead.
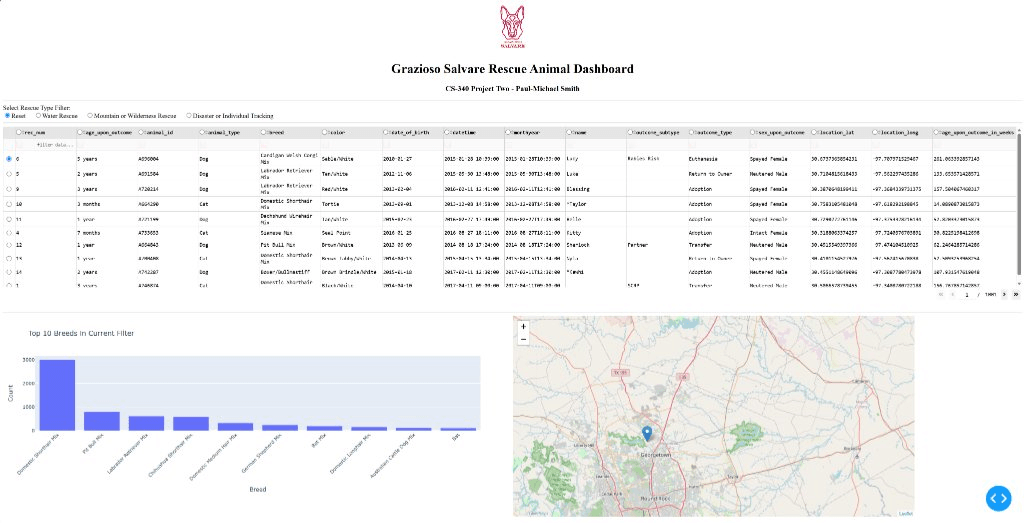
Historical CS 340 Dashboard (Reset View) — Original working client/server application interface showing interactive data table, top breeds chart, and Leaflet geolocation map.
In many enterprise and municipal organizations, operational teams need specialized views into relational or document databases without buying enterprise BI seats. This solution establishes a decoupled, three-tier architecture:
MongoDB document store optimized with compound indexes for fast filtering and aggregation over thousands of intake records.
Standalone Python class (AnimalShelterCRUD) enforcing safe projections, connection pings, and structured exception handling.
Plotly Dash reactive callback system updating client-side data tables and interactive charts simultaneously without page refreshes.
The images below are authentic historical captures of the original client/server dashboard developed during CS 340. They demonstrate the working reactive callback pipeline, dynamic multi-criteria database filtering, and synchronized Leaflet geolocation mapping.
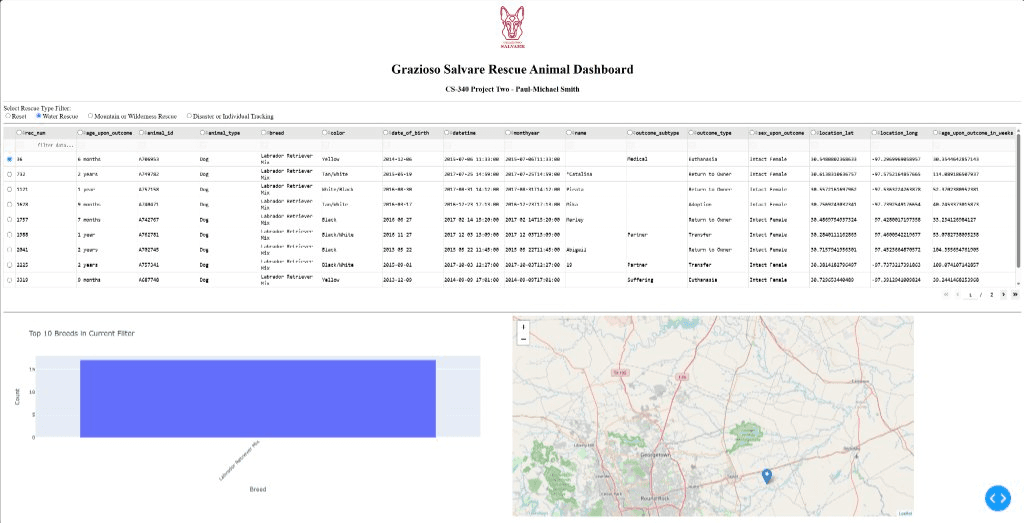
Reactive callback prunes the dataset to qualified retriever breeds and updates the chart and map coordinates.
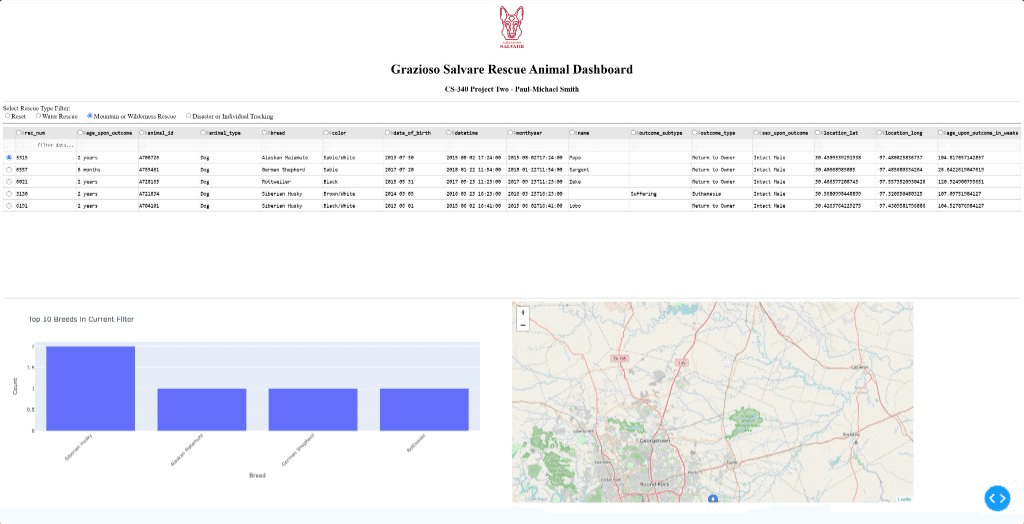
Single-click multi-criteria filter selecting Siberian Husky, Alaskan Malamute, and German Shepherd candidates.
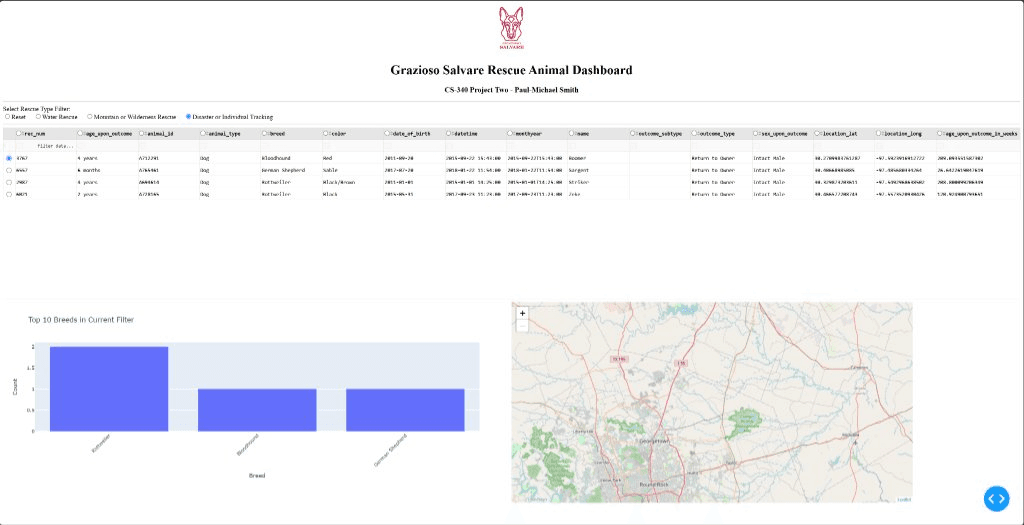
Real-time dynamic re-indexing of the Plotly bar distribution and automatic centering of the Leaflet map on individual rescue coordinates.
To maintain transparency between academic coursework prototypes and production-ready systems, here is how each component was refactored:
| Feature | Foundational CS 340 Reference | Implemented in this System | Future Roadmap |
|---|---|---|---|
| Data Access | Basic create/read scripts with classroom credentials | Sanitized, defensive CRUD module with environment variables & projection filtering | Async motor driver + Pydantic validation |
| Analytics | In-memory Python calculations | Multi-stage in-database aggregation pipelines ($facet) | Materialized views via $merge |
| Dashboard UI | Single radio button + table + Leaflet | Interactive DataTable + synchronized Plotly bar and pie charts | Leaflet GIS mapping & RBAC authentication |
Every layer of this dashboard is fully documented in our step-by-step technical guides:
How to build a clean Data Access Layer with connection pooling, explicit timeouts, and defensive CRUD operations.
Mastering $match, $group, $project, and $facet to calculate multi-dimensional KPI summaries in a single round-trip.
Structuring reactive callbacks, integrating the DAL module, and displaying dynamic Plotly charts with interactive data tables.
By isolating the database communication into a robust Python class and letting MongoDB handle analytical aggregations on disk, the resulting web dashboard remains fast, modular, and easy to maintain. This approach avoids both the licensing costs of proprietary BI platforms and the fragility of ad-hoc database queries.