Enterprise teams often rely on expensive Business Intelligence (BI) platforms just to view and filter operational database records. However, when you need custom filtering logic, direct database read/write actions, or internal tooling that doesn't warrant recurring user license costs, a lightweight self-hosted Python web app is often the most practical solution.
In Part 1, we built a clean PyMongo Data Access Layer (DAL). In Part 2, we explored high-performance aggregation pipelines.
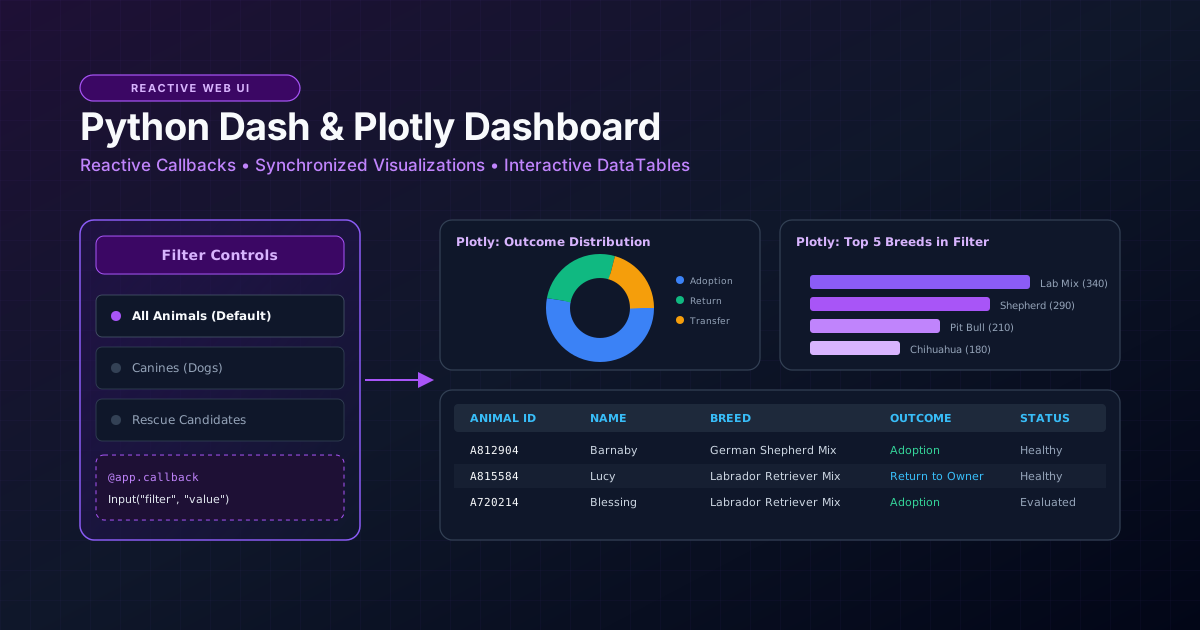
In this tutorial, we bring these layers together into a responsive, interactive web dashboard using Plotly Dash—allowing operators to filter records, view real-time breakdown charts, and inspect tabular data without writing a line of JavaScript.
Architectural Evolution: Script to Interactive Dashboard
Here is how the application architecture evolved from early prototypes to this full-featured operational dashboard:
| Capability | Early Prototype | This Tutorial's Implementation | Future Production Enhancements |
|---|---|---|---|
| Data Binding | Static table loads entire collection on launch | Reactive @app.callback pipeline filtering MongoDB records dynamically | Client-side store (dcc.Store) and server-side Redis query caching |
| UI Components | Unstyled native HTML elements | Clean Dash Core Components (dcc) and Dash Table (dash_table.DataTable) | Enterprise CSS theme with Dark Mode toggling and mobile breakpoints |
| Visualizations | None (tabular data only) | Interactive Plotly Express charts (breed distribution and outcome ratios) | GIS mapping integration (Leaflet/Mapbox) for geolocation tracking |
| Modularity | All database calls mixed with HTML UI code | Strict separation: UI layout ➔ Reactive callbacks ➔ DAL module | Role-based authentication (RBAC) and audited record updates |
Environment Setup
Install the Dash ecosystem and dependencies:
pip install dash plotly pandas pymongo python-dotenvEnsure your .env configuration points to your MongoDB instance:
MONGO_URI=mongodb://localhost:27017
MONGO_DB=operations_db
MONGO_COLLECTION=animal_shelter
Dashboard Architecture: Layout vs. Reactive Callbacks
A Dash application is structured into two fundamental concepts:
- The Component Layout (
app.layout): The declarative component tree defining what the user sees (dropdowns, charts, data tables, and headers). - Reactive Callbacks (
@app.callback): Event listeners that monitor user inputs (such as changing a dropdown selection) and update specific component outputs (such as refreshing the data table or re-rendering a chart).
[ User Selects Filter (Dropdown) ]
                │
                ▼
      @app.callback Triggered
                │
                ▼
   Query MongoDB via DAL Class
                │
                ▼
  [ Output 1: Refresh DataTable ]  <--->  [ Output 2: Refresh Plotly Chart ]
The Complete Application Code (app.py)
Below is the complete, self-contained dashboard script. It imports our AnimalShelterCRUD class from Part 1, queries the database, and exposes an interactive dashboard:
"""
app.py - Interactive Operations Dashboard using Dash, Plotly, and MongoDB
Author: PM The Tech Guy
License: MIT
"""

import os
from dash import Dash, html, dcc, dash_table, Input, Output
import plotly.express as px
import pandas as pd
from dotenv import load_dotenv

# Import our custom Data Access Layer from Part 1
from mongo_crud import AnimalShelterCRUD

load_dotenv()

# Initialize Dash application
app = Dash(__name__, title="Operations Dashboard | PM The Tech Guy")

# Initialize database DAL
db = AnimalShelterCRUD()


def get_dataframe(filter_type: str = "All") -> pd.DataFrame:
    """Fetch filtered records from MongoDB and return a Pandas DataFrame."""
    query = {}
    if filter_type == "Dogs":
        query = {"animal_type": "Dog"}
    elif filter_type == "Cats":
        query = {"animal_type": "Cat"}
    elif filter_type == "Rescue":
        query = {"status": "Evaluated"}

    # Project only fields needed for the dashboard UI
    projection = {
        "_id": 0,
        "animal_id": 1,
        "name": 1,
        "animal_type": 1,
        "breed": 1,
        "outcome_type": 1,
        "age_upon_outcome_weeks": 1,
        "status": 1
    }

    records = db.read(query=query, projection=projection, limit=500)
    if not records:
        return pd.DataFrame(columns=[
            "animal_id", "name", "animal_type", "breed", "outcome_type", "age_upon_outcome_weeks", "status"
        ])
    return pd.DataFrame(records)


# Initial data load for layout initialization
initial_df = get_dataframe("All")

# --- Application Layout ---
app.layout = html.Div(
    style={"fontFamily": "Segoe UI, Arial, sans-serif", "padding": "24px", "backgroundColor": "#f8fafc"},
    children=[
        # Header
        html.Div(
            style={"marginBottom": "24px", "borderBottom": "2px solid #e2e8f0", "paddingBottom": "16px"},
            children=[
                html.H1("Shelter Operations Command Center", style={"color": "#0f172a", "margin": "0 0 8px 0"}),
                html.P("Real-time operational filtering and demographic analytics powered by Python & MongoDB.", style={"color": "#64748b", "margin": 0}),
            ]
        ),

        # Filter Control Panel
        html.Div(
            style={"backgroundColor": "#ffffff", "padding": "16px", "borderRadius": "8px", "boxShadow": "0 1px 3px rgba(0,0,0,0.1)", "marginBottom": "24px"},
            children=[
                html.Label("Operational Filter Segment:", style={"fontWeight": "600", "color": "#334155", "display": "block", "marginBottom": "8px"}),
                dcc.RadioItems(
                    id="filter-type-selector",
                    options=[
                        {"label": " All Animals", "value": "All"},
                        {"label": " Canines (Dogs)", "value": "Dogs"},
                        {"label": " Felines (Cats)", "value": "Cats"},
                        {"label": " Rescue Training Candidates", "value": "Rescue"},
                    ],
                    value="All",
                    inline=True,
                    style={"display": "flex", "gap": "20px", "color": "#334155"}
                ),
            ]
        ),

        # Charts Section (2 Columns)
        html.Div(
            style={"display": "grid", "gridTemplateColumns": "1fr 1fr", "gap": "20px", "marginBottom": "24px"},
            children=[
                html.Div(
                    style={"backgroundColor": "#ffffff", "padding": "16px", "borderRadius": "8px", "boxShadow": "0 1px 3px rgba(0,0,0,0.1)"},
                    children=[dcc.Graph(id="outcome-pie-chart")]
                ),
                html.Div(
                    style={"backgroundColor": "#ffffff", "padding": "16px", "borderRadius": "8px", "boxShadow": "0 1px 3px rgba(0,0,0,0.1)"},
                    children=[dcc.Graph(id="top-breeds-bar-chart")]
                ),
            ]
        ),

        # Data Table Section
        html.Div(
            style={"backgroundColor": "#ffffff", "padding": "16px", "borderRadius": "8px", "boxShadow": "0 1px 3px rgba(0,0,0,0.1)"},
            children=[
                html.H3("Filtered Records", style={"color": "#0f172a", "marginTop": "0", "marginBottom": "12px"}),
                dash_table.DataTable(
                    id="records-data-table",
                    columns=[
                        {"name": "ID", "id": "animal_id"},
                        {"name": "Name", "id": "name"},
                        {"name": "Type", "id": "animal_type"},
                        {"name": "Breed", "id": "breed"},
                        {"name": "Outcome", "id": "outcome_type"},
                        {"name": "Age (Weeks)", "id": "age_upon_outcome_weeks"},
                        {"name": "Status", "id": "status"},
                    ],
                    data=initial_df.to_dict("records"),
                    page_size=10,
                    sort_action="native",
                    filter_action="native",
                    style_table={"overflowX": "auto"},
                    style_header={
                        "backgroundColor": "#f1f5f9",
                        "fontWeight": "600",
                        "color": "#1e293b",
                        "borderBottom": "2px solid #cbd5e1"
                    },
                    style_cell={
                        "padding": "10px",
                        "fontSize": "14px",
                        "textAlign": "left",
                        "color": "#334155"
                    },
                    style_data_conditional=[
                        {
                            "if": {"row_index": "odd"},
                            "backgroundColor": "#f8fafc"
                        }
                    ]
                )
            ]
        )
    ]
)


# --- Reactive Callbacks ---
@app.callback(
    [
        Output("records-data-table", "data"),
        Output("outcome-pie-chart", "figure"),
        Output("top-breeds-bar-chart", "figure"),
    ],
    [Input("filter-type-selector", "value")]
)
def update_dashboard(selected_filter: str):
    """Callback responding to filter changes: updates table records and charts."""
    df = get_dataframe(selected_filter)

    if df.empty:
        empty_fig = px.scatter(title="No records found for selection.")
        return [], empty_fig, empty_fig

    # 1. Generate Outcome Distribution Chart
    outcome_counts = df["outcome_type"].fillna("Unknown").value_counts().reset_index()
    outcome_counts.columns = ["Outcome", "Count"]
    pie_fig = px.pie(
        outcome_counts,
        values="Count",
        names="Outcome",
        title="Outcome Distribution",
        hole=0.4,
        color_discrete_sequence=px.colors.qualitative.Safe
    )
    pie_fig.update_layout(margin=dict(t=40, b=10, l=10, r=10))

    # 2. Generate Top Breeds Bar Chart
    top_breeds = df["breed"].value_counts().head(5).reset_index()
    top_breeds.columns = ["Breed", "Count"]
    bar_fig = px.bar(
        top_breeds,
        x="Breed",
        y="Count",
        title="Top 5 Breeds in Selection",
        color="Count",
        color_continuous_scale="Blues"
    )
    bar_fig.update_layout(
        margin=dict(t=40, b=10, l=10, r=10),
        xaxis_tickangle=-25,
        coloraxis_showscale=False
    )

    return df.to_dict("records"), pie_fig, bar_fig


if __name__ == "__main__":
    # Launch local server
    app.run(debug=True, port=8050)
How to Run & Test the Dashboard Locally
- Ensure MongoDB is running locally or your Atlas connection string is active in
.env. - Run the application:
python app.py - Open your browser to
http://127.0.0.1:8050. - Select the radio buttons (e.g., "Canines", "Rescue Candidates") and observe:
- The DataTable dynamically re-queries MongoDB and refreshes its rows.
- Both Plotly figures re-calculate percentages and bar distributions instantly.
- Native column sorting and text filters in the table header execute client-side.
Key Engineering Considerations for Production
- Avoid
SELECT *Style Queries: Notice inget_dataframe()that we explicitly pass a projection dictionary to the DAL. Limiting fields reduces Python memory allocation and improves browser serialization speed. - Defensive DataFrame Handling: When zero records match a filter, always return an initialized DataFrame with expected column headers rather than
None. This prevents Dash callback exceptions when building charts. - Connection Lifecycle: The
AnimalShelterCRUDinstance is instantiated once at the module level. PyMongo internally manages a thread-safe connection pool, which is reused across callback invocations without reconnecting on every click.
Series Navigation
This concludes our tutorial series on building resilient full-stack Python & MongoDB tools:
- Part 1: Building a Resilient, Reusable MongoDB CRUD Module in Python
- Part 2: MongoDB Aggregation Pipelines for Operational Reporting
- Part 3: Building Interactive Operational Dashboards with Python Dash and Plotly
- Portfolio Showcase: MongoDB and Python Interactive Operations Dashboard
To see the complete architectural case study, business impact, and full system overview, explore our MongoDB Operations Dashboard Case Study.