When building analytical dashboards or scheduled management summaries, developers frequently make a costly mistake: they query thousands of raw documents out of MongoDB into a Python script and calculate averages, counts, and groupings using in-memory Python loops or Pandas.
While this approach works during local testing on 100 documents, it falls apart in production. Network round-trips balloon, server RAM gets consumed, and query latency degrades as collection size scales into the tens or hundreds of thousands of records.
The professional pattern is to let MongoDB compute summary statistics directly on disk using the Aggregation Framework. In this guide, we will break down multi-stage pipelines step-by-step and show how to compute complex operational KPIs with a single database round-trip.
Evolution of Data Processing: Code vs. Database Engine
Understanding where work should be executed is fundamental to database performance:
| Capability | In-Memory Application Logic | This Tutorial's Aggregation Pipelines | Future Production Enhancements |
|---|---|---|---|
| Data Movement | Transfers entire collections across the network to Python | Only computed aggregates and summary metrics leave the database server | Read replicas and analytical secondary nodes (readPreference="secondaryPreferred") |
| Multi-Stage Reporting | Multiple sequential query loops and Python dictionaries | Unified single-query pipelines combining $match, $group, and $project | Materialized view caching using $merge into summary collections |
| Simultaneous KPI Metrics | Multiple round-trips to count, sum, and average different dimensions | $facet stages calculating multiple report facets concurrently | Compound index optimization with covered queries |
The Dataset Context
We are analyzing operational records from our animal rescue and shelter dataset introduced in Part 1. Each document tracks intake details, outcome types, age metrics, and GIS coordinates:
{
  "_id": "6648...",
  "animal_id": "A812904",
  "name": "Barnaby",
  "animal_type": "Dog",
  "breed": "German Shepherd Mix",
  "age_upon_outcome_weeks": 52.0,
  "outcome_type": "Adoption",
  "location_lat": 30.2672,
  "location_long": -97.7431,
  "status": "Healthy"
}
Pipeline Fundamentals: The Factory Assembly Line
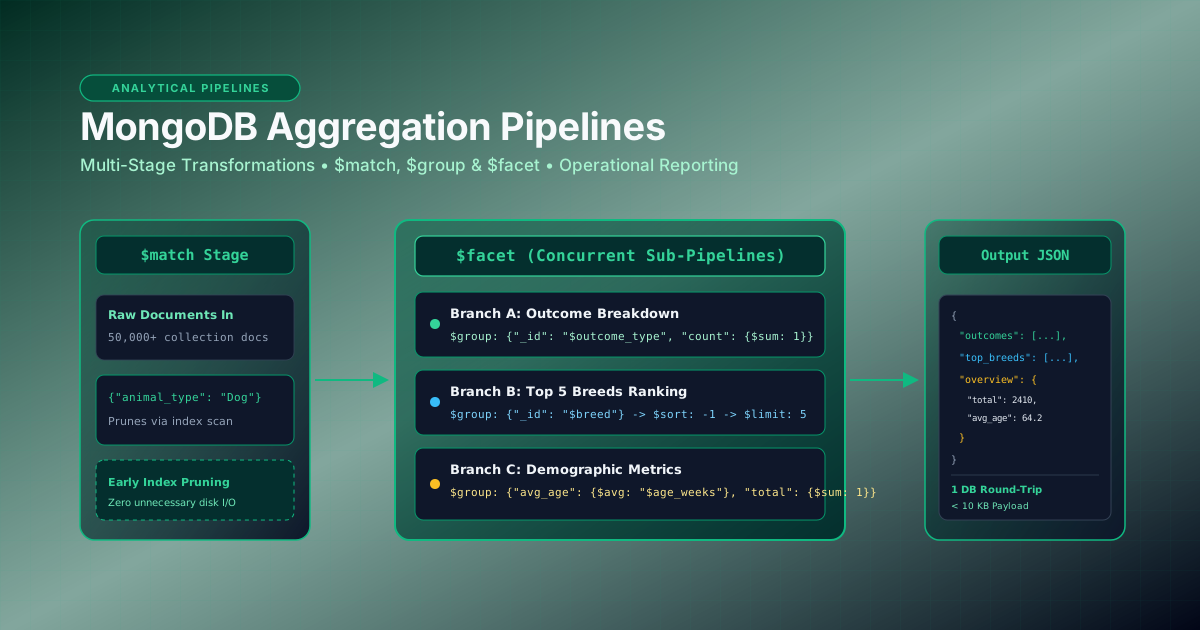
Think of a MongoDB aggregation pipeline as a factory assembly line. Documents enter at the top, pass through a series of specialized transformation stages, and emerge at the other end transformed and aggregated:
[ Raw Collection Documents ]
             │
             ▼
      Stage 1: $match   (Filter out irrelevant documents using indexes)
             │
             ▼
      Stage 2: $group   (Bucket records and compute sums / averages)
             │
             ▼
      Stage 3: $project (Shape output structure and rename fields)
             │
             ▼
      Stage 4: $sort    (Order by priority or volume)
             │
             ▼
[ Compact Reporting JSON ]
Stage 1: $match (Early Filtering)
Always filter as early as possible. Placing $match as the first stage allows MongoDB to utilize collection indexes, rapidly pruning unnecessary documents before processing starts.
pipeline = [
    {
        "$match": {
            "animal_type": "Dog",
            "age_upon_outcome_weeks": {"$gte": 26.0}
        }
    }
]
Stage 2: $group (Computing Aggregates)
The $group stage groups input documents by a specified identifier expression and applies accumulator operators such as $sum, $avg, $min, and $max.
{
    "$group": {
        "_id": "$breed",
        "total_rescues": {"$sum": 1},
        "avg_age_weeks": {"$avg": "$age_upon_outcome_weeks"}
    }
}
Stage 3: $project (Shaping the Schema)
The $project stage reshapes each document, renaming the arbitrary _id output from $group into a clean, human-readable key and rounding floating point averages.
{
    "$project": {
        "_id": 0,
        "breed": "$_id",
        "total_rescues": 1,
        "average_age_weeks": {"$round": ["$avg_age_weeks", 1]}
    }
}
Advanced Operational Reporting: Using $facet for Multi-KPI Summaries
In a real dashboard (such as an executive overview or incident command center), your UI typically needs 3 distinct metrics at once:
- Total outcome distribution (e.g., Adoption vs. Return to Owner vs. Transfer).
- Top 5 most common breeds handled.
- High-level demographic summary (average age and total count).
Running three separate queries creates three network round-trips. With MongoDB's $facet stage, you can execute all three analytical pipelines simultaneously over the filtered dataset in a single database round-trip.
Complete Python Aggregation Script
Here is a tested, production-ready script that connects to MongoDB and runs the comprehensive $facet analytics pipeline:
"""
aggregation_reporting.py - Executive metrics pipeline using PyMongo
Author: PM The Tech Guy
"""

import os
import json
from pymongo import MongoClient
from dotenv import load_dotenv

load_dotenv()

MONGO_URI = os.getenv("MONGO_URI", "mongodb://localhost:27017")
DB_NAME = os.getenv("MONGO_DB", "operations_db")
COLLECTION_NAME = os.getenv("MONGO_COLLECTION", "animal_shelter")


def generate_executive_kpi_report(animal_type: str = "Dog"):
    """
    Executes a multi-faceted aggregation pipeline in a single database round-trip.
    """
    client = MongoClient(MONGO_URI, serverSelectionTimeoutMS=5000)
    db = client[DB_NAME]
    collection = db[COLLECTION_NAME]

    pipeline = [
        # 1. Prune documents early
        {
            "$match": {
                "animal_type": animal_type
            }
        },
        # 2. Multi-faceted concurrent analytical processing
        {
            "$facet": {
                # Sub-pipeline A: Outcome breakdown
                "outcomes": [
                    {
                        "$group": {
                            "_id": "$outcome_type",
                            "count": {"$sum": 1}
                        }
                    },
                    {"$sort": {"count": -1}},
                    {
                        "$project": {
                            "_id": 0,
                            "outcome": {"$ifNull": ["$_id", "Pending/Undetermined"]},
                            "count": 1
                        }
                    }
                ],
                # Sub-pipeline B: Top 5 Breeds
                "top_breeds": [
                    {
                        "$group": {
                            "_id": "$breed",
                            "count": {"$sum": 1}
                        }
                    },
                    {"$sort": {"count": -1}},
                    {"$limit": 5},
                    {
                        "$project": {
                            "_id": 0,
                            "breed": "$_id",
                            "count": 1
                        }
                    }
                ],
                # Sub-pipeline C: High-Level Overview
                "overview": [
                    {
                        "$group": {
                            "_id": None,
                            "total_count": {"$sum": 1},
                            "average_age_weeks": {"$avg": "$age_upon_outcome_weeks"},
                            "min_age_weeks": {"$min": "$age_upon_outcome_weeks"},
                            "max_age_weeks": {"$max": "$age_upon_outcome_weeks"}
                        }
                    },
                    {
                        "$project": {
                            "_id": 0,
                            "total_count": 1,
                            "average_age_weeks": {"$round": ["$average_age_weeks", 1]},
                            "min_age_weeks": 1,
                            "max_age_weeks": 1
                        }
                    }
                ]
            }
        }
    ]

    try:
        results = list(collection.aggregate(pipeline))
        if not results:
            return {}
        return results[0]
    finally:
        client.close()


if __name__ == "__main__":
    report = generate_executive_kpi_report(animal_type="Dog")
    print(json.dumps(report, indent=2))
Sample Aggregation Output
{
  "outcomes": [
    { "outcome": "Adoption", "count": 1420 },
    { "outcome": "Return to Owner", "count": 680 },
    { "outcome": "Transfer", "count": 310 }
  ],
  "top_breeds": [
    { "breed": "Labrador Retriever Mix", "count": 340 },
    { "breed": "German Shepherd Mix", "count": 290 },
    { "breed": "Pit Bull Mix", "count": 210 },
    { "breed": "Chihuahua Shorthair", "count": 180 },
    { "breed": "Australian Cattle Dog Mix", "count": 145 }
  ],
  "overview": [
    {
      "total_count": 2410,
      "average_age_weeks": 64.2,
      "min_age_weeks": 4.0,
      "max_age_weeks": 520.0
    }
  ]
}
Optimization Checklist: Indexing Aggregation Pipelines
- Index the
$matchStage: If your first stage matches{"animal_type": "Dog", "outcome_type": "Adoption"}, ensure a compound index exists on{ animal_type: 1, outcome_type: 1 }. Runcollection.create_index([("animal_type", 1), ("outcome_type", 1)])to prevent full collection scans. - Monitor Memory Limits: In-memory sort stages (
$sortwithout an index) and group operations have a default 100MB RAM ceiling per stage in MongoDB. For large collections, relying on indexed sorting or passingallowDiskUse=Truein your query options prevents stage overflow errors. - Filter Before Transforming: Never place a
$projectstage containing computed fields before$matchif the match criteria can use an existing index.
Series Navigation
This guide is Part 2 of our hands-on series on building full-stack Python and MongoDB operations tools:
- Part 1: Building a Resilient, Reusable MongoDB CRUD Module in Python
- Part 2: MongoDB Aggregation Pipelines for Operational Reporting
- Part 3: Building Interactive Operational Dashboards with Python Dash and Plotly
- Portfolio Showcase: MongoDB and Python Interactive Operations Dashboard
In Part 3, we will integrate these aggregation outputs directly into an interactive Web UI built with Python Dash and Plotly.